


Querying pypi to fact-check AI hype
Pypi downloads allow us to see who is publicly lying; AI hype is over.

TLDR
OpenAI's growth crash (1255% to 281% YoY) signals peak GenAI API adoption phase ending (with caveats).
Azure/AWS growth (peaked again at the beginning of Q4 2024) normalizing to 97% / flat respectively indicates enterprise AI buildout cooling
Google's steady 31% baseline growth suggests market shift from hypergrowth to stability, but this is also loosing ground quickly in Jan 2025.

Background / Introduction
AI hype is still rampant - I’d queried github activity in August 2024, and this was before US government spend kicked in at the beginning of their fiscal year in Oct 2024, which gave us another [late] peak in spend / AI usage, further propagating hype-fueled AI gypsies globally. US government spend was misleading for growth, but also predictably behind the curve due to a large government moving slower than average, so how can that be parsed from any resurging enterprise growth (if exists, and as hyped)?
More realistically, what data can tell us what is real? Another way to find actual package usage is through PyPI package downloads - actual insight to adoption patterns of major AI platforms so you can compare it to any hype that states otherwise.
Caveats
These metrics serve as a proxy for developer engagement and enterprise implementation of AI technologies, due to exclusion of privately hosted packages and Conda, etc.
My bias: I’m actually over-optimistic towards AI usage. I enjoy AI development and optimizing it to where it saves time - I’m worried that a mass-media conclusion that AI isn’t what is marketed by those with a superficial understanding of technology will lead to these technical innovations never being adopted.
Technical Details
I’d queried pypi data for public downloads of python packages with fuzzy searching on keywords (obviously customizable to your questions).
# Imports and data downloads

import pandas as pd
import seaborn as sns
import numpy as np
import matplotlib.pyplot as plt
from google.cloud import bigquery
from google.oauth2 import service_account
from datetime import datetime

credential_path = # insert your credential path here

def fetch_pypi_data(credentials_path):

    credentials = service_account.Credentials.from_service_account_file(
        credentials_path,
        scopes=["https://www.googleapis.com/auth/cloud-platform"],
    )
    client = bigquery.Client(credentials=credentials, project=credentials.project_id)


    query = """
    SELECT file.project,
        FORMAT_DATE('%Y-%m', EXTRACT(DATE FROM timestamp)) AS month,
        count(*) as downloads
    FROM `bigquery-public-data.pypi.file_downloads`
    WHERE  (LOWER(file.project) LIKE '%bedrock%'
          OR LOWER(file.project) LIKE '%vertex%'
          OR LOWER(file.project) LIKE '%openai%'
          OR LOWER(file.project) LIKE '%anthropic%'
          OR LOWER(file.project) LIKE '%langchain%'
          OR LOWER(file.project) LIKE '%azure%'
          OR LOWER(file.project) LIKE '%llamaindex%'
          OR LOWER(file.project) LIKE '%neo4j%'
          OR LOWER(file.project) LIKE '%mongo%'
          OR LOWER(file.project) LIKE '%elasticsearch%'
          OR LOWER(file.project) LIKE '%boto3%'
          OR LOWER(file.project) LIKE '%equinix%'
          OR LOWER(file.project) LIKE '%ayx%'
          OR LOWER(file.project) LIKE '%amazon%'
          OR LOWER(file.project) LIKE '%alteryx%'
          OR LOWER(file.project) LIKE '%snowflake%'
          OR LOWER(file.project) LIKE '%c3ai%'
          OR LOWER(file.project) LIKE '%dataiku%'
          OR LOWER(file.project) LIKE '%salesforce%'
          OR LOWER(file.project) LIKE '%qlik%'
          OR LOWER(file.project) LIKE '%palantir%'
          OR LOWER(file.project) LIKE '%cuda%'
          OR LOWER(file.project) LIKE '%openvino%'
          OR LOWER(file.project) LIKE '%clarifai%'
          OR LOWER(file.project) LIKE '%twilio%'
          OR LOWER(file.project) LIKE '%oracle%'
          OR LOWER(file.project) LIKE '%llama%'
          OR LOWER(file.project) LIKE '%huggingface%'
          OR LOWER(file.project) LIKE '%nimble%'
          OR LOWER(file.project) LIKE '%hpe%'
          OR LOWER(file.project) LIKE '%greenlake%'
          OR LOWER(file.project) LIKE '%monday%'
          OR LOWER(file.project) LIKE '%asana%'
          OR LOWER(file.project) LIKE '%zapier%'
          OR LOWER(file.project) LIKE '%gitlab%'
          OR LOWER(file.project) LIKE '%smartsheet%'
          OR LOWER(file.project) LIKE '%uipath%'
          OR LOWER(file.project) LIKE '%braze%'
          OR LOWER(file.project) LIKE '%junos%'
          OR LOWER(file.project) LIKE '%juniper%'
          OR LOWER(file.project) LIKE '%ollama%'
          OR LOWER(file.project) LIKE '%google%'
          OR LOWER(file.project) LIKE '%gemini%'
          OR LOWER(file.project) LIKE '%gemma%'
          OR LOWER(file.project) LIKE '%nemo%'
          OR LOWER(file.project) LIKE '%zoom%')
          AND DATE(timestamp)
    BETWEEN DATE_SUB(CURRENT_DATE(), INTERVAL 730 DAY)
    AND CURRENT_DATE()
    group by 1,2
    order by 2, 1
    """

    df = client.query(query).to_dataframe()

    return df
Then format and pivot, now a boring thing to do, but sorted by the second to last month (the first complete month of downloads, since I’m querying this mid-month):
df['month'] = pd.to_datetime(df['month'])

pivot_df = df.pivot(index='project', columns='month', values='downloads')

second_last_month = sorted(pivot_df.columns)[-2]

pivot_df_sorted = pivot_df.sort_values(by=second_last_month, ascending=False)
Even after filtering on the top 20 downloads (the next step), the scale is quite effected by Amazon’s largest package - word to Amazon, but interesting dropoff that is unmatched in the previous year..
We’ll remove Amazon in the step after this for more clarity on broader trends..
plt.figure(figsize=(20, 10))
top_20_df = pivot_df_sorted.head(20).iloc[:, :-1]
for idx, row in top_20_df.iterrows():
    plt.plot(row.index, row.values, label=idx, linewidth=2)
plt.title('Download Trends - Top 20 PyPi Projects by Download Month')
plt.xlabel('Month')
plt.ylabel('Downloads')
plt.legend(bbox_to_anchor=(1.05, 1), loc='upper left')
plt.xticks(rotation=45)
plt.grid(True, alpha=0.3)
plt.tight_layout()
plt.savefig('top_projects_trends.png', bbox_inches='tight', dpi=300)
plt.show()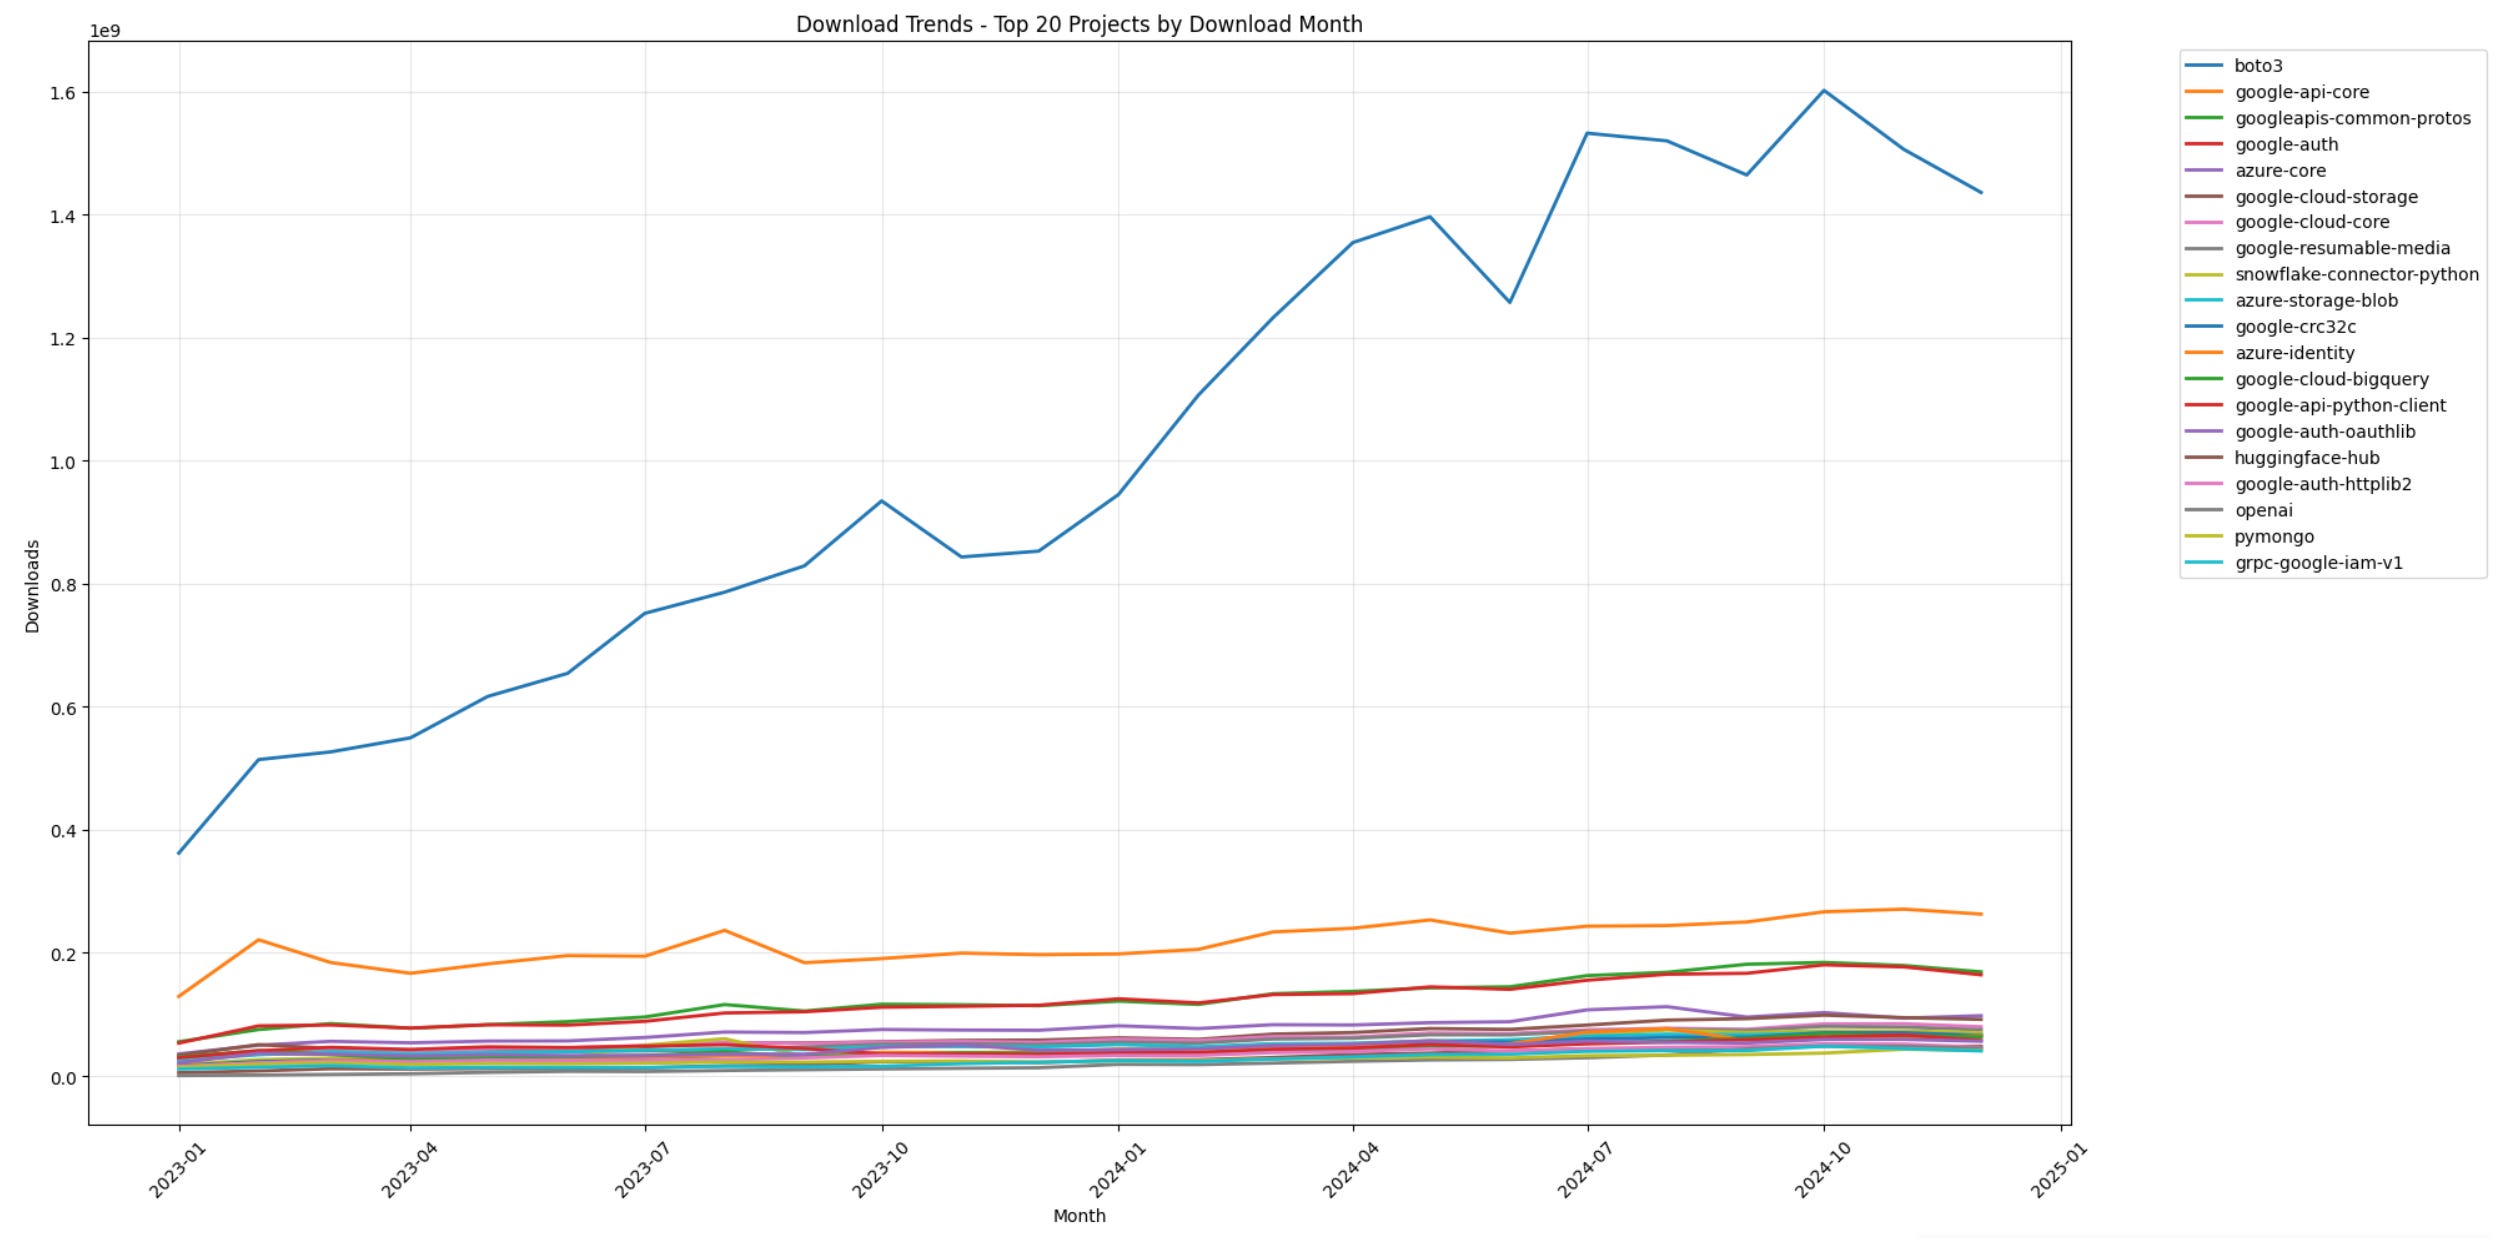
Finally, removing Amazon, the data shows Google and Azure plateauing as well as interesting plummeting of OpenAI API usage from the same quarters previous year.
plt.figure(figsize=(20, 10))
top_20_df_sans_boto3 = pivot_df_sorted.head(20).iloc[1:20, :-1]
for idx, row in top_20_df_sans_boto3.iterrows():
    plt.plot(row.index, row.values, label=idx, linewidth=2)
plt.title('Download Trends - Top 20 PyPi Project Downloads by Month Removing Boto3')
plt.xlabel('Month')
plt.ylabel('Downloads')
plt.legend(bbox_to_anchor=(1.05, 1), loc='upper left')
plt.xticks(rotation=45)
plt.grid(True, alpha=0.3)
plt.tight_layout()
plt.savefig('top_projects_trends.png', bbox_inches='tight', dpi=300)
plt.show()
For better insight, let’s look at y/y deltas by quarter, and only for the largest packages by downloads from each hyperscaler (interesting to note that in a seperate query I’d found AI API usage from these hyperscalers echoing the same trend)
pos = ['boto3', 'azure-core', 'google-cloud-core', 'snowflake-connector-python', 'openai']
filtered_df = pivot_df_sorted[pivot_df_sorted.index.isin(pos)].iloc[1:20, :-1]

melted_df = filtered_df.reset_index().melt(
    id_vars=['project'],
    var_name='date',
    value_name='downloads'
)
melted_df.columns = ['project', 'date', 'downloads']

melted_df['date'] = pd.to_datetime(melted_df['date'])
melted_df['year'] = melted_df['date'].dt.year
melted_df['quarter'] = melted_df['date'].dt.quarter

quarterly_df = melted_df.groupby(['project', 'year', 'quarter'])['downloads'].sum().reset_index()

def calculate_yoy_growth(df):
    # Sort by year within each quarter
    df = df.sort_values(['quarter', 'year'])

    # Calculate YoY growth for each quarter
    df['yoy_growth'] = (df['downloads'] / df.groupby('quarter')['downloads'].shift(1) - 1) * 100

    return df

# Calculate growth by project
quarterly_growth = quarterly_df.groupby('project').apply(calculate_yoy_growth).reset_index(drop=True)

# Filter for most recent year's growth (2024 compared to 2023)
latest_growth = quarterly_growth[quarterly_growth['year'] == 2024]
And plot these results
# Plot
plt.figure(figsize=(20, 10))
for project in pos:
    project_data = latest_growth[latest_growth['project'] == project]

    # Sort by quarter to ensure proper line connection
    project_data = project_data.sort_values('quarter')

    plt.plot(project_data['quarter'],
             project_data['yoy_growth'],
             marker='o',
             label=project,
             linewidth=2)

plt.xticks([1, 2, 3, 4], ['Q1', 'Q2', 'Q3', 'Q4'])

plt.title('Year-over-Year Quarterly Growth by Largest Project in Hyperscaler Family (2024 vs 2023)', fontsize=14, pad=20)
plt.xlabel('Quarter', fontsize=12)
plt.ylabel('YoY Growth (%)', fontsize=12)
plt.grid(True, alpha=0.3)
plt.legend(bbox_to_anchor=(1.05, 1), loc='upper left')

for project in pos:
    project_data = latest_growth[latest_growth['project'] == project].sort_values('quarter')
    for quarter, growth in zip(project_data['quarter'], project_data['yoy_growth']):
        plt.annotate(f'{growth:.2f}%',
                    (quarter, growth),
                    textcoords="offset points",
                    xytext=(0,15),
                    ha='center')

plt.tight_layout()
plt.show()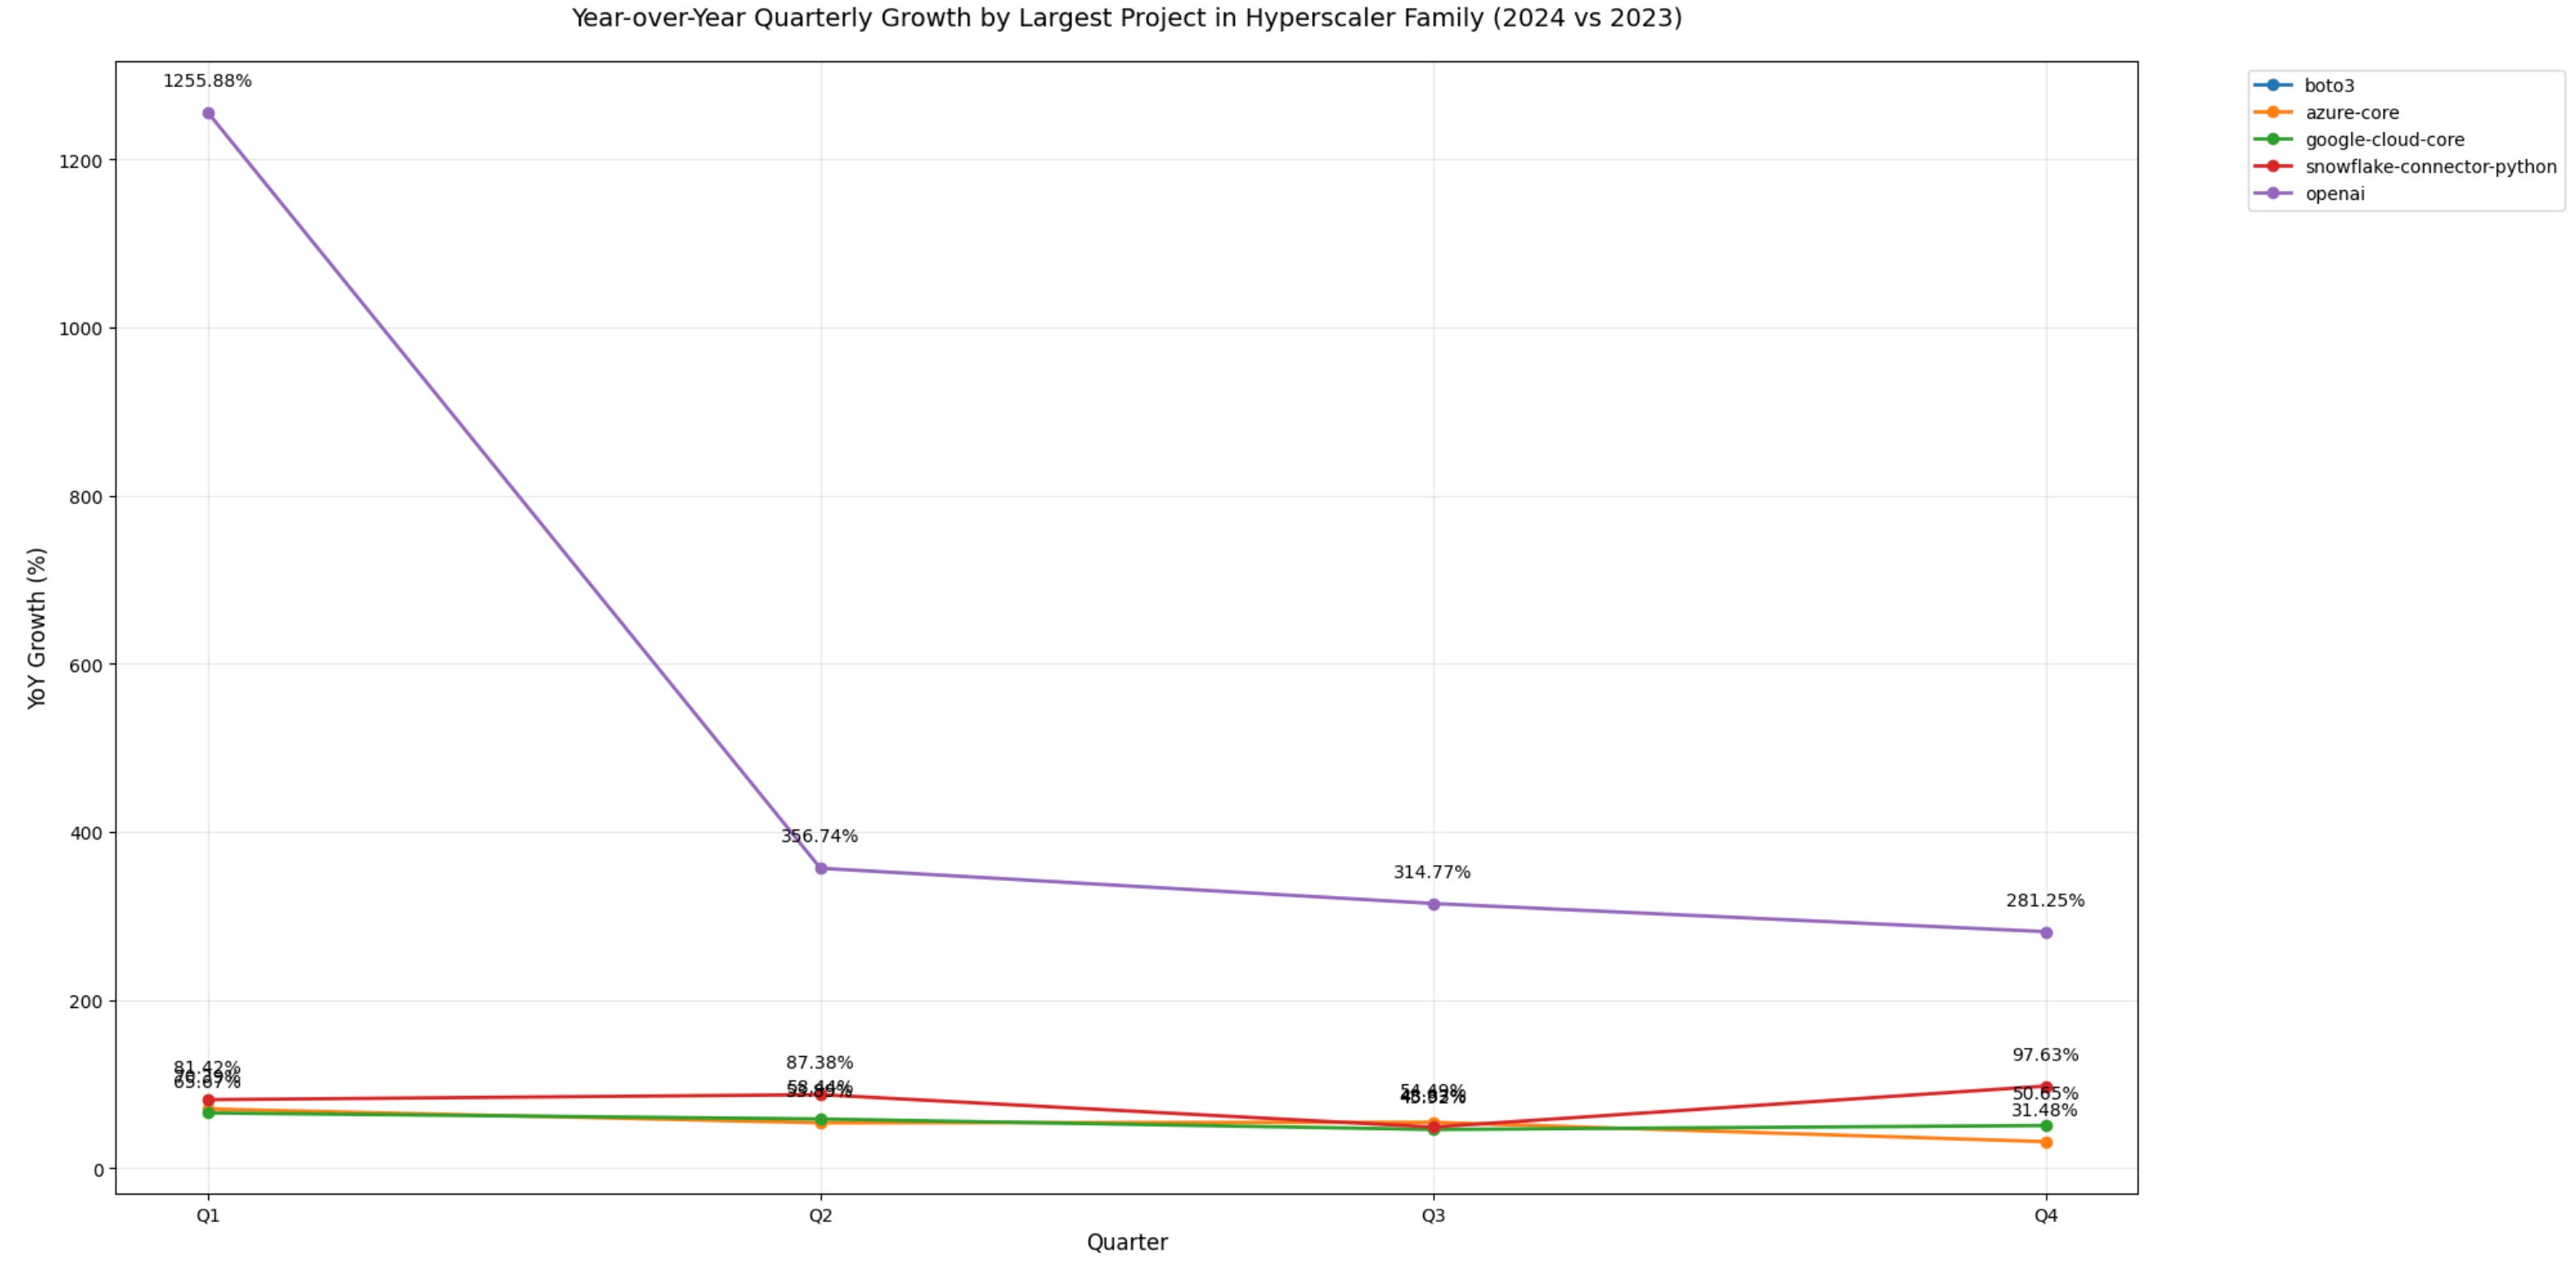
Broader Implications
Beyond the AI trends, that are obviously subsiding in contrast to hype that still continues, querying pypi can be utilized for specific packages or a proxy for development trends to potentially confirm any unintuitive claims.
Follow and feel free to cite this
@article{
    jonathanbennion,
    author = {Bennion, Jonathan},
    title = {Querying pypi to fact-check AI hype},
    year = {2025},
    month = {01},
    howpublished = {\url{https://www.jonathanbennion.info}},
    url = {https://www.jonathanbennion.info/p/querying-pypi-to-fact-check-ai-hype}
}